Friday, May 29, 2015

Learn to Code

Everyone in the 21st century needs to learn to code, right? But not everyone needs to become a software engineer or computer scientist. Automate the Boring Stuff with Pythonis written for office workers, students, administrators, and anyone who uses a computer how to write small, practical programs to automate tasks on their computer.
  • Have a folder with thousands of files that need to be renamed?
  • Need to look through thousands of rows in an Excel spreadsheet looking for ones to update?
  • Have to scrape data off of several web pages?
Normally this would involve hours of tedious clicking and typing. But programming your computer to do it can save you a lot of time and effort.
Part 1 of Automate teaches total beginners with no programming experience the Python programming language. Though Part 2 will be of interest to seasoned developers as well: It covers several modules to extend basic Python skills. Python has a gentle learning curve yet is also used by professional software developers. You don't need to know all the complexities of algorithms and syntax, you just want to write basic programs to automate mundane computer tasks. In the process, even total beginners will learn to use Python to control their computers without having to learn complex information about computer science. This is a practical programming guide for the rest of us.
Automate the Boring Stuff with Python is released under a Creative Commons license. You can read it, in full, on this website. Programming is a skill that should be in the hands of everyone: No, Seriously, You Should Learn to Code..
Support the Author: Buy the book on Amazon or
the book/ebook bundle directly from No Starch Press.
small_cover
Read the author's other free Python books:
  

Table of Contents

Part 1 - The Basics of Python Programming
  1. Introduction
  2. Python Basics
  3. Flow Control
  4. Functions
  5. Lists
  6. Dictionaries and Structuring Data
  7. Manipulating Strings
Part 2 - Automating Tasks
  1. Pattern Matching with Regular Expressions
  2. Reading and Writing Files
  3. Organizing Files
  4. Debugging
  5. Web Scraping
  6. Working with Excel Spreadsheets
  7. Working with PDF and Word Documents
  8. Working with CSV Files and JSON Data
  9. Time, Scheduling Tasks, and Launching Programs
  10. Sending Email and Text Messages
  11. Manipulating Images
  12. Controlling the Keyboard and Mouse with GUI Automation
Al Sweigart is the author of Invent Your Own Computer Games with PythonMaking Games with Python & Pygame, and Hacking Secret Ciphers with Python. His books are freely available under a Creative Commons license from http://inventwithpython.com.

https://www.youtube.com/playlist?list=PL0-84-yl1fUnRuXGFe_F7qSH1LEnn9LkW

http://pan.baidu.com/s/1gdo1tXT#path=%252FAutomate%2520the%2520Boring%2520Stuff%2520with%2520Python

Thursday, May 21, 2015

The Best Big Data And Business Analytics Companies To Work For In 2015

InsightSquaredPaxataTrifactaClouderaBirstSumo LogicGainsightGoogleAyasdi and Visier are the most recommended big data and business analytics companies by employees to friends.
These and other insights are from an analysis completed today comparing Glassdoor ratings by the companies listed in the latest Computer Reseller News Big Data 100.  CRN published the Big Data 100, a compilation of the top Big Data Infrastructure, Tools and Services,Business AnalyticsData Management, and Emerging Big Data Vendors earlier this week.  The CRN lists were used to keep the analysis and rankings fair and impartial.
Using the 2015 Big Data 100 list as a baseline to compare the Glassdoor scores of the (%) of employees who would recommend this company to a friend and (%) of employees who approve of the CEO, the following series of tables were constructed. You can find the original data set here and a PDF of the results here. There are many companies listed on the CRN list that don’t have than many or any entries on Glassdoor and they were excluded from the rankings below.  If the table is unreadable in your browser, you can view the image here.
Analytics Big Data Employer rankings May 9
Please click on the “following” button to get every new blog post as soon as its goes live.

Tuesday, May 19, 2015

List of amazing talks from New York R Conference 2015

R is undoubtedly the most popular open source data science tool loved by statisticians and analysts across the globe. It provides one of the best interactive environment for doing statistical analysis, data visualization and predictive modelling.
The language has been supported by thousands of programmers across the world. Recently, New York R Conference held its inaugural version on 24th and 25th April 2015. This conference featured R enthusiasts from across the globe.
NYR Conference 2015, R Programming

What do these talks have to offer?

The videos in these talks go on to reinforce the fact that R has the largest data science community and a thriving ecosystem to offer. From visualizing trends on Ebola virus to using machine learning for recruitment, these talks cover a wide range of topics. These talks tease you enough to get you thinking in these topics and leave you with a flavor of some of the exciting work happening across the globe. Just what you need to create the next multi-billion dollor business idea! So go on and have a look for yourself.

Predictive models & Machine learning related talks:

Hiring by Human / Machine Learning

pymetrics
In this talk, Julie Yoo talks about hiring using machine learning techniques. She discusses the benefits and challenges of using machine learning. It also talks about how machine learning algorithms are efficient and exact for voice & image recognition.

Software Architecture and Predictive Models in R

Software architechture and predictive model
A lot of people have apprehensions in using R for production use. This video talks about software architecture and the questions you need to ask to prepare a better Software Architecture. It also discuss about the role of R in building data related software products.

The Development Process for the Caret Package

the development process
This video talks about the development process, distribution and testing process of Caret package. It gives a good peek into how a package is developed, the testing process, release process and documentation. A must listen talk, if you are planning to build and release your own packages in R at some point in time!

Data Visualization related talks

Dashboarding with Shiny

Dashboarding with Shiny
This talk from Winston Chang is about dashboards and how they work. It gives you an introduction to shiny dashboards and R package for creating dashboard style layouts with shiny. It also talks about leafletjs: javascript library for creating interactive maps and use of Leaflet in shiny dashboard. In the second half of the video, it also gives you a tour of shiny dashboard having an interactive map visualization.

Interactive Plots in Shiny using R

Interactive ebola plots in shiny
Shiny is an elegant and powerful web framework for building interactive reports and visualizations using R — with or without web development skills. In this talk, a brief demonstration has been given on Shiny using R to plot Ebola data & make it interactive.

Storytelling with Data Visualizations

storytelling with data
In this talk, Vivian explains how storytelling using data visualization helps to generate insights from the data. She also talks about problems with data visualization, seam story design and discusses these with some examples. She has categorized data visualization process into four categories and talks around these (conception, data collection, Data Analysis and after that visualization).

Visual NYC

Visual NYC
If the previous talks looked like a bit of theory, here is an application. In this video, Kaz & Kristine use visualization (Shiny dashboard and leaflet) to show the rented house affordability in the city New York. They are illustrating the power of visualization to generate actionable insights.

Big Data related talks:

How Data Science is helping Influence the way Big Retailers Work

David and Goliath
Delivered by Karen Moon, this talk showcases how small start-ups and companies are using Data Science to create a disruption in large traditional markets. This video, in particular shows how her company is using Data Science and R to predict clothing trends before they hit the masses.

Practical Principles for Scalable Statistical Analysis

practical principles for scalabe statistical analysis
With increased data generation and cheap storage options, the need for scalable statistical analysis is obvious, but the solutions are not. This talk addresses this pain point directly. Delivered by Michael Kane, this talk tells about different libraries and packages in R and Python which can be used to scale Data Exploration practically. He uses these methods to improve the performance and handle large amount of data.

Leveraging R, Hadoop in Analyzing Multiple Myeloma Patient Timelines

Leveraging RHadoop in analyzing multiple patients
Delivered by Saar Golde, Chief Data Scientist of Knowledgent, this video starts with talking about Big Data in Pharma Research and the challenges faced in Analyzing Real World Evidences. It then points to some solutions for the same using Hadoop and MapReduce technologies.

Making R Go Faster and Bigger

Making R go faster and Bigger
This video talks about Big Data and challenges which come with it like storing, processing and computing. The speaker also talks about efficient techniques and functions in R to deal with big data calculations and how you can enhance the performance.

Other talks:

DataFrames: The Good, Bad, and Ugly

Data frames - good bad ugly
How can a conference on R not talk about DataFrames? And who better to talk about it than Wes McKinney (Father of Pandas in Python). Wes briefly talks about data frame interfaces, biased information judgments and thoughts on crafting high quality data tools. He also talks about pandas, spark and Julia data frames.

Reproducible Data Analysis with Revolution R Open

Reproducible data analysis with Revolution R open
In this video, Joseph Rickert talks about reproducible data analysis and packages of past using library checkpoint. He also talks about how this library helps you to solve the problem of different versions of packages. When you share your scripts with others it using this library, it automatically installs the necessary packages. This checkpoint library only works with CRAN packages.

R for every survey analysis

R for every survival analysis
In this talk, Max Richman tells about his learnings from moving young surveyors from commercial software like SAS and SPSS to R (or python) i.e. FOSSS (Fresh and open source software). Max talks about real world situations like variable recoding & statitistical weighing and how R provides an ease in handling data.

End Notes

So, these were some R-related talks in inaugural version of New York R Conference. The idea of a conference in this fashion is definitely exciting and so were the talks. If you have seen PyCon workshops and talks, you might feel that the talks are not as hands on and technical as PyCons, but this was just the inaugural version. Also, the talks were aimed to be high level to cover the breadth of offerings R has to offer. It would be interesting to see how it pans out next year!
We hope you enjoyed and learned watching them. Do let us know your thoughts and views in the comments section below. We would love to talk with you !

Saturday, May 16, 2015

Review of top 10 online Data Science courses

As more and more of life’s day-to-day work and personal activities are being simplified by Big Data technologies, the need for data scientists has risen remarkably for the past several years. Companies around the world scamper desperately to grab people with data science skills, and are willing to shell out big bucks to keep these data-crazed workers in their payroll. Experts agree that data science is still in its fledgling state, it will become a pervasive force pretty soon. If you want to learn data science and become a data science expert, check out our reviews of the following courses!
1) Harvard Data Science Course
The course is a combination of various data science concepts such as machine learning, visualization, data mining, programming, data munging, etc. You will be using popular scientific Python libraries such as Numpy, Scipy, Scikit-learn, Pandas throughout the course. I suggest you to complete machine learning course on coursera before taking this course, as machine learning concepts such as PCA (dimensionality reduction), k-means and logistic regression are not covered in depth. But remember, you have to invest lot of time to complete this course, especially the home work exercises are very challenging.
If you are good at statistics and programming take this course. 2014 version of Harvard data science course is going on. You can access the lecture videos here.
Prerequisites: Cs50 and Stat 100
Programming Language: Python
Course Length: 4 months
Difficulty: Very high
Taught By:  Hanspeter Pfister and Joe Blizsten
 Reviews by others:

2) Analytics Edge

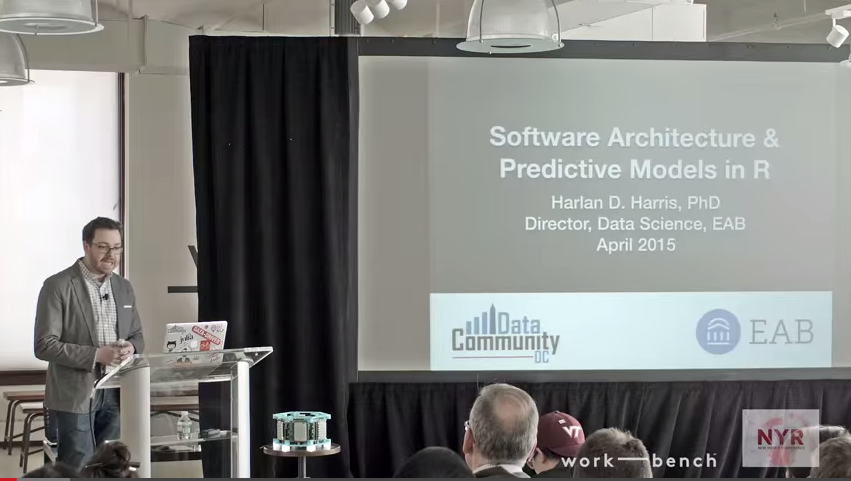
The course gives a good intro to R and also gives hands on experience with statistical modelling techniques. The course has real world examples of how analytics have been used to significantly improve a business or industry. The workload is high, but the lectures and problem sets are well organized and structured. If you’re interested in learning some practical analytic methods that don’t require a ton of math background to understand, this is the course for you.
Prerequisites: Basic knowledge of mathematics
Programming Language: R, Libre office/Excel
Course Length: 11 weeks
Difficulty: High
Reviews by others:  Course Talk.

3) Machine Learning Course On Coursera

Data science and machine learning are closely related. Apart from machine learning the course shows you how to handle high dimensional data(Pca), introduces to map reduce, bias vs variance, learning curves, etc. The course is taught using Octave( alternative for matlab), there are set of videos that shows you how to use octave. It is better to have some knowledge of calculus before taking this course, so Consider taking MIT multivariable calculus course.
Prerequisites: Basic linear algebra and Calculus
Programming Language: Octave
Course Length: 11 weeks
Difficulty: Low
Taught By:  Andrew Ng
Reviews by others:

4) Data Analyst Nano Degree Udacity

A Nanodegree, provided by Udacity and AT&T , is an online certification that you can earn in 6-12 months (10-20 hours/week) for $200/month. Udacity’s Data Science track teaches R, Python, MongoDB and Hadoop. The courses cover both theory and practice of Data Science, and every course ends with a project that allows you to demonstrate what you learned. The projects can be the start of your portfolio of work to share with others, especially recruiters. The prerequisites are pretty high, you need a variety of skills before taking this course.
Course Length: 12 months(10 hours/ week)
Difficulty: Very high
Taught by: Chen Hang Lee and Miriam Swords Kalk

5) Introduction To Computational Thinking And Data Science

The course provides a brief introduction to plotting, stochastic programs, probability and statistics, random walks, Monte Carlo simulations, modeling data, optimization problems, and clustering. Even if you have little programming experience you can learn a lot from this course. The course serves as a motivation for the beginners in Python and data science.
Prerequisites: Introduction to computer science and python programming
Programming Language: Python
Course Length: 9 weeks(12 hours/week)
Difficulty: Intermediate
Reviews about the course:  Mooctivity

6) Coursera Intro To Data Science Course

The class gives a broad introduction to various concepts of data science. The first programming exercise “Twitter Sentiment Analysis in Python” is challenging, and rest of the assignments requires less time commitment. Professor Bill Howe assumes that you know statistics, Python, and SQL, you really need to know them because the lectures are so poor. Before taking this course, go through standford’s data base course, learn Python programming concepts from code academy, learn basic statistics, and basics of machine learning. Don’t expect this course to introduce you to these concepts. Despite its shortcomings, the course explains a lot about relational databases, Map Reduce and No -sql. The course is not intended for beginners.
Prerequisites: Basics of Python, statistics, basic knowledge of databases.
Taught by: Bill howe
Programming language: Python and R
Length: 3 months
Difficulty: intermediate
Reviews about the course: Course Talk and Quora

7) Johns Hopkinson Data Science Course

R programming, exploratory data analysis and cleaning data modules are really well taught and practical. The statistical inference and regression model structure modules are not well organized; they have too much material for some one new to it. Data scientist tool box module is a waste of time; you can see the reviews of this module here: data science tool box.
Project swirl is a fun way to learn R. Most of the time the professor just reads the slides without adding any additional information. Certain concepts are not clearly explained, so you will spend more time googling and learning those concepts. It is too traditional and too heavy in statistics in particular.
Prerequisites: Working knowledge of mathematics up to algebra and some programming knowledge.
Taught by: Brian Caffo
Programming language: R
Length: 12 months
Difficulty: Intermediate
Reviews about the course: Tech Powered math

8) Foundations Of Data Analysis

The course focuses only on statistics and gives hands on experience with descriptive and inferential statistical concepts in R. If you want to learn R and statistical concepts, then this course is for you. You will be working with a well formatted data sets, so you won’t be learning data munging in this course. At end of this course you will be comfortable using different statistical techniques to solve your own problems about your own data using R.
Prerequisites: None
Taught by: Micheal J. Mahometa
Programming language: R
Length: 13 weeks(3-6 hours/week)
Difficulty: Intermediate
Reviews about the course: Course Talk

9) Data Science In Action

The course is based on the book “Process Mining” written by professor Wil van der Aals. If you are a business professional and don’t have prior programming experience, then this course is for you. The course acts as a classical divide between “business” and “IT”. The course uses many examples using real-life event logs to illustrate the concepts and algorithms. After taking this course, you will be able to run process mining projects and have a good understanding of the Business Process Intelligence field.
Prerequisites: A basic understanding of logic, sets, and statistics (at the undergraduate level).
Taught by: Wil Van Der Aalst
Programming Language/Tools:  ProMDiscoRapid Miner
Length: 13 weeks(3-6 hours/week)
Difficulty: Easy

10) Mining Massive Datasets

The class will introduce you to fundamental algorithms and techniques to deal with Big Data, such as MapReduce, Locality Sensitive Hashing, Page Rank, and algorithms for Large Graphs and Data Streams. It will teach you how to apply these tool-kits to important practical applications, such as Web Search, Recommender Systems and Online Advertising. This course gives a special attention to dimensionality reduction. A book based on this course is available for free. The course expects you to have good knowledge of database and algorithms.
Prerequisites: Basic course on algorithms, data structures and databases
Programming Langauge/Tools: SQL
Length: 7 weeks
Difficulty: Intermediate
Reviews about the course: Quora

Conclusion:

Some of the upcoming courses in data analysis are computational methods for data analysis, data analysis and statistical inference, coding the matrixData camp is a great place to learn R. To learn Python for data analysis, you can check out my post.
So, what other courses  are worth taking if you want to get a good education in data science?
- See more at: http://bigdata-madesimple.com/review-of-top-10-online-data-science-courses/#sthash.fnUC81LT.dpuf