Monday, September 7, 2015

Powerful Guide to learn Random Forest (with codes in R & Python)

Introduction

Random Forests is panacea to all data science problems!
Random Forest models have risen significantly in their popularity – and for some real good reasons. They can be applied quickly to any data science problems to get first set of benchmark results. They are incredibly powerful and can be implemented quickly out of the box.
Please note that I am saying first set of results and not all results. Because they have a few limitations as well. In this article, I’ll introduce you to the most interesting aspects of applying Random Forest in your predictive models.
powerful guide to learn random forest in R and Python

Table of Contents

  1. History of Random Forest
  2. What is Random Forest?
  3. How to implement Random Forest in Python and R?
  4. How does it work?
  5. Pros and Cons associated with Random Forest
  6. How to tune Parameters of Random Forest?
  7. Practice Problem

History of Random Forest

Leo_Breiman random forestThe history began way back in 1980s. This algorithm was a result of incessant team work by Leo Breiman, Adele Cutler, Ho Tin Kam, Dietterich, Amit and Geman. Each of them played a significant role in early development of random forest. The algorithm for actuating a random forest was developed by Leo Breiman and Adele Cutler. This algorithm is register in their (Leo and Adele) trademark. Amit, Gemen, Ho Tim Kam, independently introduced the idea of random selection of features and using Breiman’s ‘Bagging’ idea constructed this collection of decision trees with controlled variance. Later, Deitterich introduced the idea of random node optimization.                                                                                                                                                  Leo Breiman
What is Random Forest?

Random Forest is a versatile machine learning method capable of performing both regression and classification tasks. It also undertakes dimensional reduction methods, treats missing values, outlier values and other essentialsteps of data exploration, and does a fairly good job. It is a type of ensemble learning method, where a group of weak models combine to form a powerful model.
In Random Forest, we grow multiple trees as opposed to a single tree in CART model (see comparison between CART and Random Forest here, part1 and part2). To classify a new object based on attributes, each tree gives a classification and we say the tree “votes” for that class. The forest chooses the classification having the most votes (over all the trees in the forest) and in case of regression, it takes the average of outputs by different trees.
Forest-Canopy1

Python & R implementation:

Random forests have commonly known implementations in R packages and Python scikit-learn. Let’s look at the code of loading random forest model in R and Python below:
Python
#Import Library
from sklearn.ensemble import RandomForestClassifier #use RandomForestRegressor for regression problem
#Assumed you have, X (predictor) and Y (target) for training data set and x_test(predictor) of test_dataset
# Create Random Forest object
model= RandomForestClassifier(n_estimators=1000)
# Train the model using the training sets and check score
model.fit(X, y)
#Predict Output
predicted= model.predict(x_test)

R Code
library(randomForest)
x <- cbind(x_train,y_train)
# Fitting model
fit <- randomForest(Species ~ ., x,ntree=500)
summary(fit)
#Predict Output 
predicted= predict(fit,x_test)

Now that you know how to run random forest (I bet, that wasn’t difficult), let’s understand how random forest algorithm works?

How Random Forest algorithm works?

In Random Forest, each tree is planted & grown as follows:
  1. Assume number of cases in the training set is N. Then, sample of these N cases is taken at random but with replacement. This sample will be the training set for growing the tree.
  2. If there are M input variables, a number m<M is specified such that at each node, m variables are selected at random out of the M. The best split on these m is used to split the node. The value of m is held constant while we grow the forest.
  3. Each tree is grown to the largest extent possible and  there is no pruning.
  4. Predict new data by aggregating the predictions of the ntree trees (i.e., majority votes for classification, average for regression).
all-data-set
To understand more in detail about this algorithm using a case study, please read this article “Introduction to Random forest – Simplified“.

Pros and Cons of Random Forest

Pros:

  • As I mentioned earlier, this algorithm can solve both type of problems i.e. classification and regression and does a decent estimation at both fronts.
  • One of benefits of Random forest which excites me most is, the power of handle large data set with higher dimensionality. It can handle thousands of input variables and identify most significant variables so it is considered as one of the dimensionality reduction methods. Further, the model outputs Importance of variable, which can be a very handy feature. Look at the below image of variable importance from currently Live Hackathon 3.x.
    Variable_Important
  • It has an effective method for estimating missing data and maintains accuracy when a large proportion of the data are missing.
  • It has methods for balancing errors in datasets where classes are imbalanced.
  • The capabilities of the above can be extended to unlabeled data, leading to unsupervised clustering, data views and outlier detection.
  • Random Forest involves sampling of the input data with replacement called as bootstrap sampling. Here one third of the data is not used for training and can be used to testing. These are called the out of bag samples. Error estimated on these out of bag samples is known as out of bag error. Study of error estimates by Out of bag, gives evidence to show that the out-of-bag estimate is as accurate as using a test set of the same size as the training set. Therefore, using the out-of-bag error estimate removes the need for a set aside test set.

Cons:

  • It surely does a good job at classification but not as good as for regression problem as it does not give continuous output. In case of regression, it doesn’t predict beyond the range in the training data, and that they may over-fit data sets that are particularly noisy.
  • Random Forest can feel like a black box approach for statistical modelers – you have very little control on what the model does. You can at best – try different parameters and random seeds!

How to Tune Parameters of Random Forest?

Till now, we have looked at the basic random forest model, where we have used the default values of various parameters except n_estimators=1000. Here we will look at the different parameters, its importance and methods to tune. Below is the syntax of Random Forest model in python scikit-learn.
class sklearn.ensemble.RandomForestClassifier(n_estimators=10, criterion='gini', max_depth=None,min_samples_split=2, min_samples_leaf=1, min_weight_fraction_leaf=0.0, max_features='auto', max_leaf_nodes=None,bootstrap=True, oob_score=False, n_jobs=1, random_state=None, verbose=0, warm_start=False, class_weight=None)
Follow definition of these metrics here.
Modulation_Parameters
These parameters play a vital role in adjusting the accuracy of your random forest model. The intelligent use of these metrics improve the power of model significantly. To understand this aspect in more detail, you can refer this article “Tuning parameters of random forest model“.

Practice Problem

In currently Live, Hackathon 3.x – Predict customer worth for Happy Customer Bank, a binary classification problem is given. This problem has 24 input variables( mix of both categorical and continuous variables). Input variables have missing values, outlier values and unbalanced distribution of numerical variables.
After we’ve finished hypothesis generation and basic data exploration, my next step is to use a classification algorithm. I can choose from various classification algorithms like Logistic, SVM, Random Forest and many others. But here, I’ll compare the performance of logistic regression and random forest model.
For initial model, I have not done any feature engineering and data cleaning. Let’s look at the output of these three models and their relative performance:
Step-1: Initial steps of importing libraries and reading data:
import pandas as pd
import numpy as np
from sklearn.ensemble import RandomForestClassifier
from sklearn.linear_model import LogisticRegression
from sklearn import preprocessing
from sklearn.metrics import roc_curve, auc
number = preprocessing.LabelEncoder()
train=pd.read_csv('C:/Users/Analytics Vidhya/Desktop/Hackathon3.x/Final_Files/Train.csv')

Step-2: Convert categorical variable to numpy arrays and fill NaN values to zero.
def convert(data):
number = preprocessing.LabelEncoder()
data['Gender'] = number.fit_transform(data.Gender)
data['City'] = number.fit_transform(data.City)
data['Salary_Account'] = number.fit_transform(data.Salary_Account)
data['Employer_Name'] = number.fit_transform(data.Employer_Name)
data['Mobile_Verified'] = number.fit_transform(data.Mobile_Verified)
data['Var1'] = number.fit_transform(data.Var1)
data['Filled_Form'] = number.fit_transform(data.Filled_Form)
data['Device_Type'] = number.fit_transform(data.Device_Type)
data['Var2'] = number.fit_transform(data.Var2)
data['Source'] = number.fit_transform(data.Source)
data=data.fillna(0)
return data
train=convert(train)

Step-3: Split the data set to train and validate
train['is_train'] = np.random.uniform(0, 1, len(train)) <= .75
train, validate = train[train['is_train']==True], train[train['is_train']==False]

Step-4: Build Logistic and look at the roc_auc (evaluation metric of this challenge)
lg = LogisticRegression()
lg.fit(x_train, y_train)
Disbursed_lg=lg.predict_proba(x_validate)
fpr, tpr, _ = roc_curve(y_validate, Disbursed_lg[:,1])
roc_auc = auc(fpr, tpr)
print roc_auc
Output: 0.535441187235

Step-5: Build Random and look at the roc_auc
rf = RandomForestClassifier()
rf.fit(x_train, y_train)
disbursed = rf.predict_proba(x_validate)
fpr, tpr, _ = roc_curve(y_validate, disbursed[:,1])
roc_auc = auc(fpr, tpr)
print roc_auc
Output: 0.614586623764

Step-6: Build Random Forest with n_estimtors=1000 and look at the roc_auc
rf = RandomForestClassifier(n_estimators=1000)
rf.fit(x_train, y_train)
disbursed = rf.predict_proba(x_validate)
fpr, tpr, _ = roc_curve(y_validate, disbursed[:,1])
roc_auc = auc(fpr, tpr)
print roc_auc
Output: 0.824606785363

By looking at above models, it is clear that random forest with tuned parameter has better results than other two. You can further improve the model power by tuning other parameters also. Above, we have not done any feature engineering, you can populate featured variable(s), treat missing or outlier values, combine multiple models and generate a powerful ensemble methods. This competition is Live till 11th September 2015, therefore, I can’t discuss more as it will violate T&C of competition.

End Note

In this article, we looked at one of most common machine learning algorithm Random Forest followed by its pros & cons, method to tune parameters and explained & compared it using a practice problem. I would suggest you to use random forest and analyse the power of this model by tuning the parameters.

Monday, June 8, 2015

Friday, May 29, 2015

Learn to Code

Everyone in the 21st century needs to learn to code, right? But not everyone needs to become a software engineer or computer scientist. Automate the Boring Stuff with Pythonis written for office workers, students, administrators, and anyone who uses a computer how to write small, practical programs to automate tasks on their computer.
  • Have a folder with thousands of files that need to be renamed?
  • Need to look through thousands of rows in an Excel spreadsheet looking for ones to update?
  • Have to scrape data off of several web pages?
Normally this would involve hours of tedious clicking and typing. But programming your computer to do it can save you a lot of time and effort.
Part 1 of Automate teaches total beginners with no programming experience the Python programming language. Though Part 2 will be of interest to seasoned developers as well: It covers several modules to extend basic Python skills. Python has a gentle learning curve yet is also used by professional software developers. You don't need to know all the complexities of algorithms and syntax, you just want to write basic programs to automate mundane computer tasks. In the process, even total beginners will learn to use Python to control their computers without having to learn complex information about computer science. This is a practical programming guide for the rest of us.
Automate the Boring Stuff with Python is released under a Creative Commons license. You can read it, in full, on this website. Programming is a skill that should be in the hands of everyone: No, Seriously, You Should Learn to Code..
Support the Author: Buy the book on Amazon or
the book/ebook bundle directly from No Starch Press.
small_cover
Read the author's other free Python books:
  

Table of Contents

Part 1 - The Basics of Python Programming
  1. Introduction
  2. Python Basics
  3. Flow Control
  4. Functions
  5. Lists
  6. Dictionaries and Structuring Data
  7. Manipulating Strings
Part 2 - Automating Tasks
  1. Pattern Matching with Regular Expressions
  2. Reading and Writing Files
  3. Organizing Files
  4. Debugging
  5. Web Scraping
  6. Working with Excel Spreadsheets
  7. Working with PDF and Word Documents
  8. Working with CSV Files and JSON Data
  9. Time, Scheduling Tasks, and Launching Programs
  10. Sending Email and Text Messages
  11. Manipulating Images
  12. Controlling the Keyboard and Mouse with GUI Automation
Al Sweigart is the author of Invent Your Own Computer Games with Python, Making Games with Python & Pygame, and Hacking Secret Ciphers with Python. His books are freely available under a Creative Commons license from http://inventwithpython.com.

https://www.youtube.com/playlist?list=PL0-84-yl1fUnRuXGFe_F7qSH1LEnn9LkW

http://pan.baidu.com/s/1gdo1tXT#path=%252FAutomate%2520the%2520Boring%2520Stuff%2520with%2520Python

Thursday, May 21, 2015

The Best Big Data And Business Analytics Companies To Work For In 2015

InsightSquared, Paxata, Trifacta, Cloudera, Birst, Sumo Logic, Gainsight, Google, Ayasdi and Visier are the most recommended big data and business analytics companies by employees to friends.
These and other insights are from an analysis completed today comparing Glassdoor ratings by the companies listed in the latest Computer Reseller News Big Data 100.  CRN published the Big Data 100, a compilation of the top Big Data Infrastructure, Tools and Services,Business Analytics, Data Management, and Emerging Big Data Vendors earlier this week.  The CRN lists were used to keep the analysis and rankings fair and impartial.
Using the 2015 Big Data 100 list as a baseline to compare the Glassdoor scores of the (%) of employees who would recommend this company to a friend and (%) of employees who approve of the CEO, the following series of tables were constructed. You can find the original data set here and a PDF of the results here. There are many companies listed on the CRN list that don’t have than many or any entries on Glassdoor and they were excluded from the rankings below.  If the table is unreadable in your browser, you can view the image here.
Analytics Big Data Employer rankings May 9
Please click on the “following” button to get every new blog post as soon as its goes live.

Tuesday, May 19, 2015

List of amazing talks from New York R Conference 2015

R is undoubtedly the most popular open source data science tool loved by statisticians and analysts across the globe. It provides one of the best interactive environment for doing statistical analysis, data visualization and predictive modelling.
The language has been supported by thousands of programmers across the world. Recently, New York R Conference held its inaugural version on 24th and 25th April 2015. This conference featured R enthusiasts from across the globe.
NYR Conference 2015, R Programming

What do these talks have to offer?

The videos in these talks go on to reinforce the fact that R has the largest data science community and a thriving ecosystem to offer. From visualizing trends on Ebola virus to using machine learning for recruitment, these talks cover a wide range of topics. These talks tease you enough to get you thinking in these topics and leave you with a flavor of some of the exciting work happening across the globe. Just what you need to create the next multi-billion dollor business idea! So go on and have a look for yourself.

Predictive models & Machine learning related talks:

Hiring by Human / Machine Learning

pymetrics
In this talk, Julie Yoo talks about hiring using machine learning techniques. She discusses the benefits and challenges of using machine learning. It also talks about how machine learning algorithms are efficient and exact for voice & image recognition.

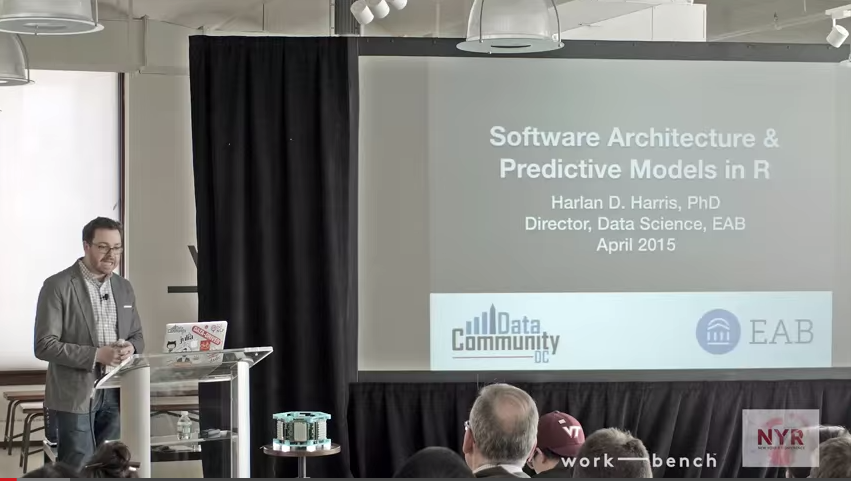
Software Architecture and Predictive Models in R

Software architechture and predictive model
A lot of people have apprehensions in using R for production use. This video talks about software architecture and the questions you need to ask to prepare a better Software Architecture. It also discuss about the role of R in building data related software products.

The Development Process for the Caret Package

the development process
This video talks about the development process, distribution and testing process of Caret package. It gives a good peek into how a package is developed, the testing process, release process and documentation. A must listen talk, if you are planning to build and release your own packages in R at some point in time!

Data Visualization related talks

Dashboarding with Shiny

Dashboarding with Shiny
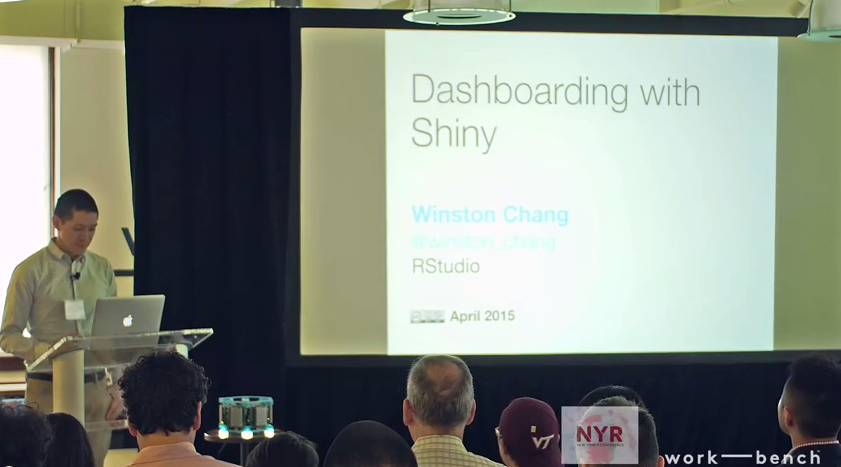
This talk from Winston Chang is about dashboards and how they work. It gives you an introduction to shiny dashboards and R package for creating dashboard style layouts with shiny. It also talks about leafletjs: javascript library for creating interactive maps and use of Leaflet in shiny dashboard. In the second half of the video, it also gives you a tour of shiny dashboard having an interactive map visualization.

Interactive Plots in Shiny using R

Interactive ebola plots in shiny
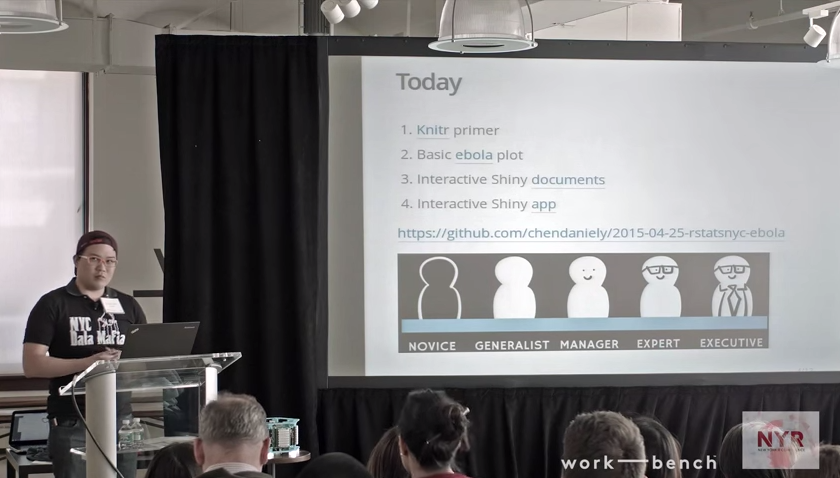
Shiny is an elegant and powerful web framework for building interactive reports and visualizations using R — with or without web development skills. In this talk, a brief demonstration has been given on Shiny using R to plot Ebola data & make it interactive.

Storytelling with Data Visualizations

storytelling with data
In this talk, Vivian explains how storytelling using data visualization helps to generate insights from the data. She also talks about problems with data visualization, seam story design and discusses these with some examples. She has categorized data visualization process into four categories and talks around these (conception, data collection, Data Analysis and after that visualization).

Visual NYC

Visual NYC
If the previous talks looked like a bit of theory, here is an application. In this video, Kaz & Kristine use visualization (Shiny dashboard and leaflet) to show the rented house affordability in the city New York. They are illustrating the power of visualization to generate actionable insights.

Big Data related talks:

How Data Science is helping Influence the way Big Retailers Work

David and Goliath
Delivered by Karen Moon, this talk showcases how small start-ups and companies are using Data Science to create a disruption in large traditional markets. This video, in particular shows how her company is using Data Science and R to predict clothing trends before they hit the masses.

Practical Principles for Scalable Statistical Analysis

practical principles for scalabe statistical analysis
With increased data generation and cheap storage options, the need for scalable statistical analysis is obvious, but the solutions are not. This talk addresses this pain point directly. Delivered by Michael Kane, this talk tells about different libraries and packages in R and Python which can be used to scale Data Exploration practically. He uses these methods to improve the performance and handle large amount of data.

Leveraging R, Hadoop in Analyzing Multiple Myeloma Patient Timelines

Leveraging RHadoop in analyzing multiple patients
Delivered by Saar Golde, Chief Data Scientist of Knowledgent, this video starts with talking about Big Data in Pharma Research and the challenges faced in Analyzing Real World Evidences. It then points to some solutions for the same using Hadoop and MapReduce technologies.

Making R Go Faster and Bigger

Making R go faster and Bigger
This video talks about Big Data and challenges which come with it like storing, processing and computing. The speaker also talks about efficient techniques and functions in R to deal with big data calculations and how you can enhance the performance.

Other talks:

DataFrames: The Good, Bad, and Ugly

Data frames - good bad ugly
How can a conference on R not talk about DataFrames? And who better to talk about it than Wes McKinney (Father of Pandas in Python). Wes briefly talks about data frame interfaces, biased information judgments and thoughts on crafting high quality data tools. He also talks about pandas, spark and Julia data frames.

Reproducible Data Analysis with Revolution R Open

Reproducible data analysis with Revolution R open
In this video, Joseph Rickert talks about reproducible data analysis and packages of past using library checkpoint. He also talks about how this library helps you to solve the problem of different versions of packages. When you share your scripts with others it using this library, it automatically installs the necessary packages. This checkpoint library only works with CRAN packages.

R for every survey analysis

R for every survival analysis
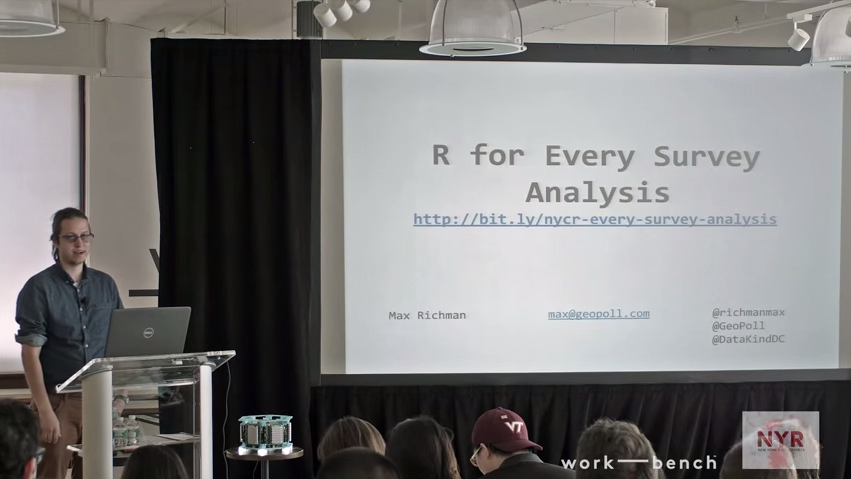
In this talk, Max Richman tells about his learnings from moving young surveyors from commercial software like SAS and SPSS to R (or python) i.e. FOSSS (Fresh and open source software). Max talks about real world situations like variable recoding & statitistical weighing and how R provides an ease in handling data.

End Notes

So, these were some R-related talks in inaugural version of New York R Conference. The idea of a conference in this fashion is definitely exciting and so were the talks. If you have seen PyCon workshops and talks, you might feel that the talks are not as hands on and technical as PyCons, but this was just the inaugural version. Also, the talks were aimed to be high level to cover the breadth of offerings R has to offer. It would be interesting to see how it pans out next year!
We hope you enjoyed and learned watching them. Do let us know your thoughts and views in the comments section below. We would love to talk with you !